Financial markets move on information, and increasingly, that information flows through social media before it reaches anywhere else. A tweet from an analyst, a headline reposted by a trader, a single word like “downgrade” are all signals that can move prices. The question this project explores is simple: Can a machine be trained to reliably tell a bullish post from a bearish one?
The Data
The dataset contains 9,543 financial tweets, each labelled as Bearish, Bullish, or Neutral. Since the goal is binary classification, Neutral tweets were removed, leaving 3,365 tweets split roughly 57% Bullish and 43% Bearish.
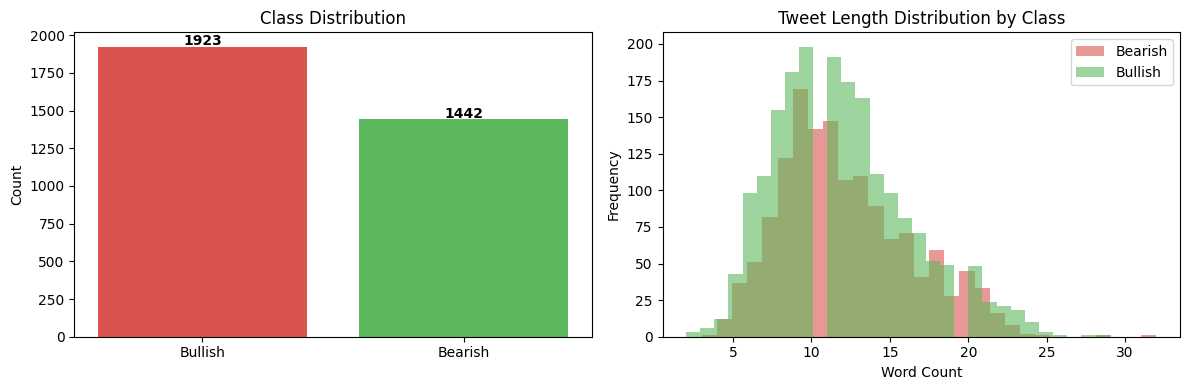
The class imbalance is modest but worth noting. There are more Bullish tweets than Bearish ones in the data, which subtly influences how models behave. Interestingly, Bearish and Bullish tweets are nearly identical in length, so tweet length alone tells us nothing useful about sentiment.
Turning Words Into Numbers
Computers cannot deterministically make sense of text. They read numbers. The core challenge in any text classification problem is finding the right way to convert language into something a model can learn from.
Two approaches were used here:
TF-IDF (Term Frequency–Inverse Document Frequency) treats each word (and two-word phrase) as a feature and scores it by how often it appears in a tweet relative to how common it is across all tweets. A word like “downgrade” that appears frequently in Bearish tweets but rarely overall gets a high score. A word like “the” that appears everywhere gets a low score.
Before applying TF-IDF, tweets were cleaned:
- URLs and special characters removed
- Stock tickers normalised (e.g.
$BYND→tickerbynd) - Words reduced to their root form via stemming (e.g. “raising”, “raised”, “raises” → “rais”)
FinBERT is an entirely different approach. Rather than counting words, it uses a large language model pre-trained specifically on financial text to understand the meaning of a tweet in context. More on this later.
The Models
Five traditional machine learning models were trained on the TF-IDF features, then FinBERT was tested separately as a more advanced alternative.
A 75/25 train/test split was used throughout, with stratification to preserve the class balance in both sets.
Results: What Worked — and What Didn’t
| Model | Test Accuracy | ROC-AUC |
|---|---|---|
| Logistic Regression | 74.9% | 0.859 |
| Naive Bayes | 78.7% | 0.928 |
| Support Vector Classifier | 84.3% | — |
| Neural Network | 86.3% | 0.935 |
| Random Forest | 81.2% | 0.908 |
| FinBERT + Logistic Regression | 87.7% | 0.943 |
ROC-AUC measures how well a model separates the two classes across all decision thresholds, a score of 1.0 is perfect, 0.5 is no better than a coin flip. All models performed well above chance.
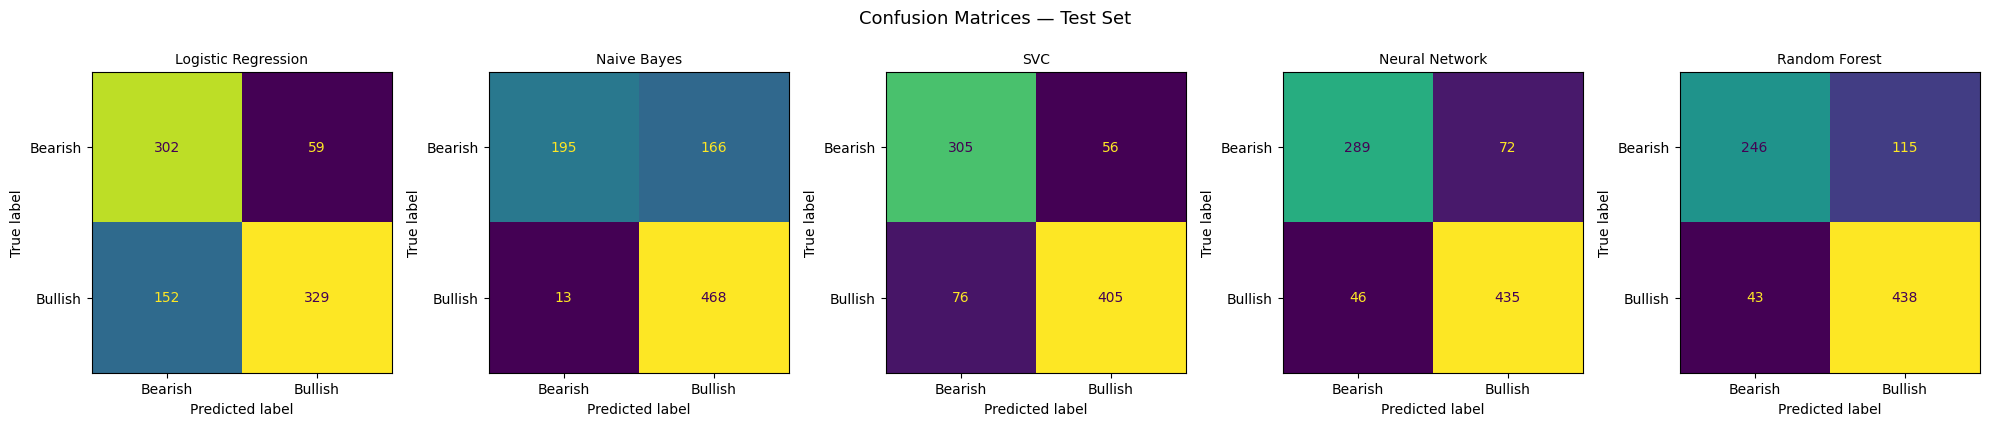
The standout story: Naive Bayes
Naive Bayes achieved a reasonable overall accuracy of 78.7%, but its confusion matrix reveals a serious flaw. it classified 97.3% of Bullish tweets correctly while getting only 54% of Bearish tweets right. In practice, this model has a strong bias toward predicting Bullish, which would be dangerous in any real application. Missing a bearish signal in a portfolio context is exactly the kind of error that costs money.
Logistic Regression: balanced but limited
Logistic Regression was the most balanced model: 84% recall on Bearish tweets and 68% on Bullish. It was also the most interpretable: by examining the model’s coefficients, we can see directly which words drove each prediction.
Top words driving Bullish predictions: up, beat, raise, rise, higher, buy, upgrade, gain, jump
Top words driving Bearish predictions: down, miss, lower, downgrade, cut, fall, warn, slide, drop, loss
These align precisely with how a finance professional would intuitively read a headline. The model has, in effect, learned a basic financial vocabulary from the data alone.
The Neural Network leads the TF-IDF pack
The Neural Network (a small two-layer architecture) achieved the best balance of accuracy and class recall among the traditional models — 86.3% overall, with 80% recall on Bearish and 91% on Bullish. It also generalised well, suggesting the architecture was not simply memorising the training data.
Where the Models Struggled: Error Analysis
Examining the Neural Network’s 115 misclassified tweets reveals why this problem is genuinely hard, even for humans.
Predicted Bullish, actually Bearish:
“More stockmarket volatility, less buying the dip, and slower earnings per share growth ahead, Goldman Sachs says”
“EIA forecasts U.S. shale oil output to climb by 49,000 barrels a day in December”
The first contains words like “buying” that typically signal Bullish sentiment. The second includes “climb”, a positive word, despite describing an output increase that could be bearish for prices. Context and domain knowledge matter enormously here.
Predicted Bearish, actually Bullish:
“Fed’s ‘bazooka’ soothes dollar funding squeeze”
“Jobless Americans to see extra payments as soon as this week”
“Squeeze” and “Jobless” look negative in isolation, but both tweets carry a broadly positive market implication. A word-counting model has no way of knowing this.
FinBERT: Context Changes Everything
FinBERT is a version of BERT, one of the most significant advances in natural language AI, fine-tuned specifically on financial documents. Rather than treating words as isolated signals, it reads each tweet as a sequence and understands relationships between words.
The approach here was to use FinBERT purely as a feature extractor: each tweet was passed through the model to produce a rich numerical representation capturing its financial meaning, then a simple Logistic Regression was trained on those representations.
The result: 87.7% accuracy and 0.943 ROC-AUC, the best of all models tested, with strong recall on both Bearish (87.3%) and Bullish (87.9%) classes.
Crucially, FinBERT is the only model that could plausibly handle tweets like the “bazooka” example above; because it was trained on enough financial text to understand that a central bank intervention, however colourfully described, is typically market-positive.
Key Takeaways
1. Word-counting methods work, but have clear limits. TF-IDF models learned a credible financial vocabulary and performed well on straightforward tweets. They struggle the moment sentiment depends on context rather than individual words.
2. High accuracy can hide dangerous blind spots. Naive Bayes looked reasonable on paper but was nearly blind to Bearish signals. In any real-world application like risk management, trade signal generation, news monitoring, recall on each class matters as much as overall accuracy.
3. Financial language is genuinely ambiguous. Many misclassified tweets were ambiguous even by human standards. Words like “climb”, “squeeze”, and “bazooka” carry very different meanings depending on what surrounds them. This is precisely the problem FinBERT was built to address.
4. Pre-trained financial models meaningfully outperform bag-of-words. FinBERT’s improvement over the best TF-IDF model was modest in percentage terms but consistent across both classes and the gap would likely widen on more complex or nuanced financial text.
Built using Python, scikit-learn, and HuggingFace Transformers. Dataset: Twitter Financial News Sentiment (Zeroshot / HuggingFace).