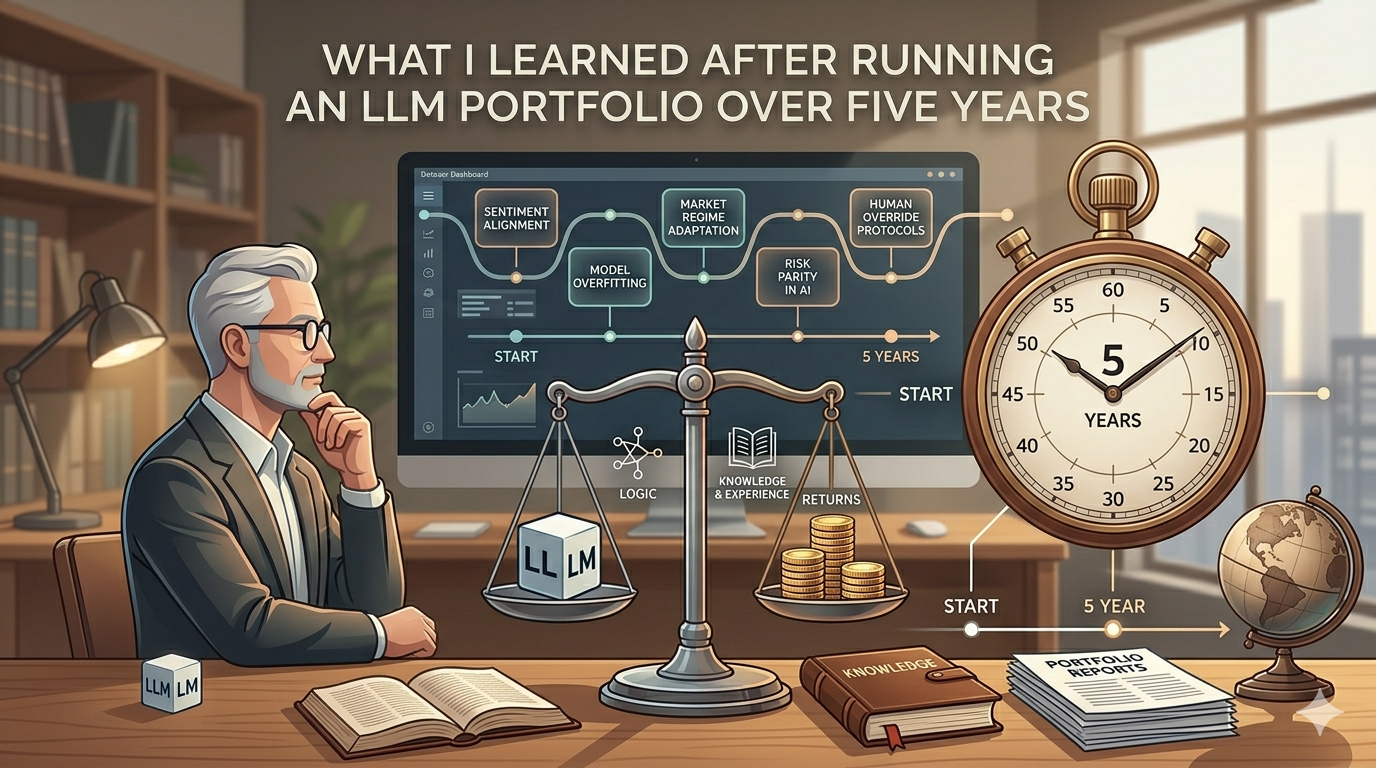
When I started this research, I expected the AI portfolio to win.
A large language model can process earnings calls, Federal Reserve communications, market indicators, and macroeconomic data all at once. That is roughly what experienced investors do when they sit down to make allocation decisions. The bet was that doing it at scale, across thousands of documents, would improve the result.
It did not.
Over the five-year out-of-sample period, the LLM-enhanced portfolio generated a Sharpe Ratio of 0.767. The strongest quantitative benchmark came in at 0.856. Looking at those numbers on their own, the conclusion seems simple: the AI did not work.
But the numbers were hiding something.
The Results
Here is how the main strategies compared across the full evaluation period:
| Strategy | Sharpe Ratio |
|---|---|
| Minimum Variance | 0.879 |
| Signal-Enhanced Minimum Variance | 0.856 |
| LLM-Enhanced Portfolio | 0.767 |
The LLM underperformed both quantitative benchmarks, including the Signal-Enhanced portfolio that already incorporated momentum signals, volatility regime adjustments, and yield curve data. On a pure risk-adjusted basis, there was no case for the AI approach.
One number did not fit neatly into that picture. The LLM-enhanced portfolio generated a statistically significant Fama-French alpha, meaning the model was capturing information that standard risk factors do not explain. It was not producing random noise. Something real was being picked up; it just was not making its way into better returns. Figuring out why that gap existed became the most instructive part of the whole project.
Why the LLM Lost
The Correlation Problem
The portfolio universe was ten U.S. equity ETFs, and they are not independent assets.
Technology, growth, and large-cap equities move together across most market environments. Energy and financials have their own dynamics, but the universe was still heavily correlated on average. When assets move together like that, rotating between them does not produce much in the way of active returns. There was a structural ceiling on what any tactical allocation model could achieve here, and the LLM was up against it from the start.
The Noise Problem
To reduce randomness in the outputs, I ran Llama 3.1 8B five times each month and averaged the results. That helped, but language models are stochastic: the same inputs do not always produce the same outputs. Each monthly run could return meaningfully different portfolio weights. Averaged across five runs the signal-to-noise ratio improved, but it was never clean. Over five years of monthly decisions, that noise accumulates and it drags on performance.
The Ridge Regression Test
At some point I started asking a question I probably should have asked earlier: was the value coming from the LLM, or from the features it was given?
The model was working with earnings sentiment features, Fed sentiment features, momentum signals, volatility data, and yield curve information. Those inputs might carry predictive power on their own, regardless of how they are processed. To check, I trained a Ridge Regression model on exactly the same features.
| Strategy | Sharpe Ratio |
|---|---|
| Ridge Regression | 0.870 |
| LLM-Enhanced Portfolio | 0.767 |
The simple regularised model beat the LLM by a substantial margin.
That result reframed the picture. The features contained genuine predictive information. The LLM was not using them better than a well-tuned linear model. If anything, it was using them worse. The value was in the data, not in the reasoning layer on top.
The Discovery That Changed My Conclusion
The overall Sharpe numbers pointed one way: quantitative models win, close the notebook.
Breaking the results down by time period told a different story:
| Period | LLM Sharpe Ratio |
|---|---|
| 2021 to 2022 | 0.603 |
| 2023 to 2025 | 0.968 |
Same model, same architecture, same features, but completely different performance depending on what the market was doing. Averaged across five years the LLM looked mediocre. Split into two periods it looked like two different models. The aggregate number was not wrong, it was just not asking the right question.
When the AI Actually Worked
November 2023 is the clearest example of the model doing what it was built for.
The Fed had been hiking aggressively throughout 2022 and into 2023. By late 2023, inflation was coming down and the language coming out of the FOMC was shifting. The pivot from tightening to pausing was becoming visible in the text before it showed up clearly in the data.
The model saw it. Earnings calls across technology and consumer sectors were turning more optimistic. Fed communications were softening on inflation. Importantly, the model’s five runs that month came back with similar answers, which is what a high confidence score reflects in this system. It rotated toward growth with some conviction.
That call worked. Growth equities ran through the first half of 2024, and the portfolio was already there.
When the AI Failed
March 2025 looked completely different.
Tariff announcements were creating sharp uncertainty. Earnings calls were contradictory: companies were reporting decent recent results while simultaneously pulling forward guidance and flagging supply chain risk. The macro picture was moving faster than the corporate fundamentals. Earnings sentiment came in cautiously positive, Fed communications were hawkish, volatility was elevated, and yield curve signals were ambiguous. The signals pointed everywhere at once.
The model had no way to make sense of that, but it did not say so. Across five runs, it produced high confidence scores. Reading through the outputs, I found something specific: the model was referencing an inverted yield curve in its reasoning when the yield curve was not actually inverted. It had filled in context that was not there, and it had done it with apparent certainty.
That is a different problem from getting the allocation wrong. A bad call can come from bad luck or an unusual environment. Generating false context while appearing certain is a structural issue with how the confidence mechanism was working.
The Real Contribution
The key lesson was not the headline result. It was understanding when the model should and should not be trusted.
The confidence mechanism counted how many signals were firing above a threshold. More signals meant higher confidence. That works when markets are coherent. It breaks down when markets are full of contradictory information, because activity and agreement are not the same thing.
November 2023 worked because everything pointed in the same direction. Earnings sentiment, Fed tone, and macro signals were all telling a consistent story, and the five model runs agreed with each other. Confidence was high because agreement was high.
In March 2025, signals were active and contradictory. The confidence score was high because a lot was happening, not because any clear picture was forming. The mechanism measured volume when it should have been measuring coherence. A better system would distinguish between those two states: not just how many signals are firing, but whether they are saying the same thing.
Final Thoughts
The thesis did not establish that LLMs outperform quantitative models. The numbers are clear on that.
What it did show is that qualitative information is not irrelevant to portfolio decisions. The Fama-French alpha was real. The November 2023 call was not an accident. The signal was there; the architecture was not yet good enough to use it reliably under all conditions.
Small open-source models run locally are probably better understood as feature processors right now than as autonomous portfolio decision makers. They can translate text into signals. Synthesising those signals under ambiguous market conditions, without hallucinating context or overclaiming certainty, is still a hard problem.
The regime results leave room for optimism. More capable models, a confidence framework built around signal coherence rather than signal volume, and better access to real-time information could change what is achievable here. That is worth building toward.
Language carries information that moves markets. Extracting it reliably, without the noise eating the signal, is the part that still needs work.